Resort rental yield depends on a short list of measurable drivers: occupancy rate, average daily rate (ADR), operating cost structure, regulatory compliance status, local supply growth, and your financing terms. Get those six inputs right and your pro forma will reflect reality. Miss one and your projected net yield can swing by several percentage points in the wrong direction.
Here is what each driver does to your bottom line:
- Occupancy rate — the single largest revenue lever; a 10% drop in occupancy directly reduces gross income by 10%
- Average daily rate (ADR) — multiplied by occupancy to produce gross revenue; amenity and location premiums show up here first
- Operating costs — management fees, cleaning, utilities, insurance, strata fees, and capital reserves; typically 35–55% of gross revenue in Canadian resort markets
- Regulatory and CRA compliance — non-compliant short-term rental (STR) activity can trigger deduction disallowance under CRA rules that materially increases taxable income
- Local supply growth — rising supply compresses ADR and occupancy; national Canadian STR supply grew significantly year-over-year in 2025, outpacing revenue growth modestly year-over-year
- Financing terms — interest rate and loan-to-value ratio determine whether positive cash flow is achievable at a given purchase price
The first calculation to run is net yield, or cash-on-cash return if you are financing. Those two numbers tell you whether the property pencils out before you spend a dollar on due diligence. A compliance check on zoning and municipal licensing should happen at the same time, because a property that cannot legally operate as a short-term rental has no yield to model.
Key takeaways
Net yield, regulatory compliance, and local supply growth are the three variables that most consistently separate resort rental investments that perform from those that disappoint.
| Point | Details |
|---|---|
| Calculate net yield first | Use NOI ÷ purchase price; Ontario waterfront properties typically yield 2%–6% net depending on location and management. |
| Verify compliance before modelling | CRA disallows deductions for non-compliant STR days; a partial-year compliance gap can add thousands to your tax bill. |
| Stress-test occupancy and ADR | A 10-point occupancy drop combined with a $50 ADR reduction can significantly reduce net yield on a typical resort condo. |
| Monitor supply growth signals | Canadian national STR supply grew roughly 22.4% year-over-year in 2025 against revenue growth of approximately 15.5%; markets where supply outpaces revenue signal rising competition. |
| Karinrotem for Friday Harbour analysis | Karinrotem provides property-specific pro forma review, strata bylaw checks, and market analysis for resort investors targeting Friday Harbour and Innisfil. |
How to calculate gross and net rental yield for a resort property
Gross yield is annual rental revenue divided by purchase price, expressed as a percentage. Net yield replaces revenue with net operating income (NOI), which is revenue minus all operating expenses before debt service.
- Gross yield = (Annual gross rental revenue ÷ Purchase price) × 100
- Net yield = (NOI ÷ Purchase price) × 100
- Cash-on-cash return = (Annual pre-tax cash flow after debt service ÷ Cash invested) × 100
Worked example: a resort condo at Friday Harbour
Assume a two-bedroom condo purchased for $650,000.
That produces negative cash flow of roughly $6,778 per year, meaning cash-on-cash return is negative at those assumptions. The property may still make sense as a long-term hold if appreciation is part of the thesis, but the numbers must be modelled honestly. Net yields on Ontario waterfront properties typically range 2%–6% depending on location, unit quality, and management approach.
Pro Tip: *The two line items investors most consistently underestimate in resort markets are seasonal cleaning and the capital reserve. Cleaning costs in resort communities are higher per turn than urban rentals because of distance, linen volume, and seasonal surge pricing from local cleaning services.
Resort-specific factors that move ADR, occupancy, and yield
The drivers of vacation rental profitability in a resort community differ meaningfully from those in an urban market. Location within the resort, the type of resort, and the amenity package each carry measurable ADR and occupancy premiums that you need to model explicitly.
- Seasonality and peak-period concentration — most Canadian resort markets generate 60–75% of annual revenue in a compressed peak season (summer for lake properties, winter for ski). Ontario seasonal occupancy patterns show sharp shoulder-season drops that can cut monthly revenue by 50% or more outside peak weeks.
- Proximity to the primary attraction — ski-in/ski-out units at Whistler or waterfront-direct units at Friday Harbour command ADR premiums of 20–40% over comparable units a short drive away. Distance to the shoreline or lifts is one of the strongest single predictors of ADR.
- Resort type (ski, lake, golf, four-season) — four-season resorts like Friday Harbour reduce seasonality risk by offering marina, golf, and dining year-round. Single-season resorts carry higher off-season vacancy risk that must be stress-tested in the pro forma.
- Unit sleeping capacity — larger units (3BR+) attract group bookings that push gross revenue higher, but they also carry higher cleaning costs, more wear, and greater sensitivity to group-booking cancellations.
- Amenities: hot tubs, docks, parking — Whistler market data shows amenities like hot tubs can materially increase revenue, with well-positioned units earning disproportionately more than the market average. Private docks and waterfront access drive similar premiums in Ontario lake markets.
- On-site resort services and marketing — properties within a managed resort programme (concierge, central booking, resort marketing) often achieve higher occupancy than self-managed units in the same community, though the programme fee reduces net yield.
- Zoning and tourist-accommodation designation — this is the legal prerequisite, not a yield driver. In Whistler, for example, properties must carry the correct zoning to operate as nightly rentals at all. Without it, the revenue projection is irrelevant.
Well-optimised waterfront cottages in Ontario can earn $40,000–$120,000+ in gross seasonal revenue depending on lake, configuration, and management quality. That range illustrates how much the factors above actually matter: the spread between a poorly positioned, under-amenitised unit and a well-positioned one on the same lake can be $50,000 or more in gross annual income.
Pro Tip: When a 3BR unit’s group-booking premium looks attractive, model the cleaning cost per turn carefully. A group turnover at a larger cottage can cost $300–$500 per clean versus $120–$180 for a one-bedroom condo. The ADR uplift needs to cover that cost differential and the higher wear-and-tear reserve before the larger unit genuinely outperforms on net yield.

For a detailed breakdown of the types of income properties available at Ontario resorts and their typical income profiles, that guide covers cottages, condos, and chalets side by side.
Operating costs unique to resort rentals and how management choices affect net yield
Operating costs in a resort rental are structurally higher than in a long-term rental, and they vary more with occupancy. Understanding the cost structure before you buy is what separates a realistic pro forma from a wishful one.
Typical cost categories for a Canadian resort property include:
- Property management fees — full-service managers in resort markets typically charge 20–30% of gross revenue, which is higher than urban STR management. The premium reflects the complexity of seasonal operations, guest services, and distribution across platforms.
- Cleaning and turnover — this is often the second-largest cost after management. Frequency is driven by booking patterns, and in peak season, back-to-back bookings can mean multiple turns per week.
- Utilities — guest-use utilities (heating, cooling, hot tub operation, Wi-Fi) are fully borne by the owner and spike in peak season. A lakefront property with a hot tub can see utility costs of $6,000–$10,000 annually.
- Seasonal opening and closing — winterising a cottage or opening a lakefront property in spring involves plumbing, dock installation, and mechanical checks. Budget $1,500–$3,500 per cycle depending on property complexity.
- Insurance — a standard homeowner policy does not cover short-term rental activity. An STR-specific rider or commercial policy adds cost but is non-negotiable for coverage.
- Strata or HOA fees — resort communities often carry higher strata fees than urban condos because they fund amenity maintenance (pools, marinas, fitness centres). These fees are fixed regardless of occupancy.
- Capital reserve — amenity-heavy properties depreciate faster. A 5% gross revenue reserve is a reasonable starting point; properties with hot tubs, docks, or appliance-heavy kitchens should model higher.
Professional management tends to increase net yield when the manager’s pricing optimisation and distribution reach generate enough additional revenue to offset the fee premium. This is most likely when you are managing remotely, when the property is in a competitive market with dynamic pricing opportunities, or when you lack the time to handle guest communications and maintenance coordination personally. Self-management remains viable for owners who live nearby, have reliable local trades, and are willing to manage bookings actively. For a practical breakdown of the trade-offs, the short-term rental management best practices guide covers the decision framework in detail.
Pro Tip: Contract your cleaning and linen service separately from your property manager if possible. Sourcing a reliable local cleaning team directly and paying them at market rate gives you cost control and often better service continuity through peak season.
How financing and interest rates change your net yield and cash flow
The difference between gross yield and cash-on-cash return is entirely a function of your financing.
Cash vs. financed: same property, different outcomes
Using the worked example from the calculation section above (NOI of $26,222 on a $650,000 property):
- All-cash purchase: cash-on-cash return equals net yield at 4.0%. No debt service, no interest-rate risk.
- 70% LTV mortgage ($455,000 at 5.5%, 25-year amortisation): annual debt service of approximately $33,000 produces negative annual cash flow of roughly $6,778. Cash-on-cash return on the $195,000 equity deployed is approximately negative 3.5%.
That gap is not a reason to avoid financing, but it is a reason to model it honestly. Many resort investors accept negative cash flow in the early years because they are underwriting appreciation alongside yield. The risk is that appreciation assumptions do not materialise while interest rates stay elevated.
Break-even and stress-testing
Your debt service coverage ratio (DSCR) is NOI divided by annual debt service. A DSCR below 1.0 means the property does not cover its mortgage from rental income alone. For the example above, DSCR = $26,222 ÷ $33,000 = 0.79.
Run at least three stress scenarios before committing:
- Occupancy shock: reduce occupancy by 10 percentage points (55% to 45%) and recalculate NOI. In the example, that drops gross revenue by roughly $12,800 and NOI to approximately $13,400.
- ADR compression: reduce ADR by 10% ($350 to $315) and recalculate. Gross revenue falls by approximately $6,300.
- Rate spike: model the same mortgage at 7% instead of 5.5%. Annual debt service rises to approximately $38,500, deepening the cash flow deficit.
Pro Tip: Run all three shocks simultaneously as your worst-case scenario. If the property still has a credible path to break-even within three years under that combined stress, the risk profile is manageable. If it requires all assumptions to go right just to reach break-even, the margin of safety is too thin.
Resort properties carry more revenue volatility than urban rentals because of seasonality and weather dependence.
Canada-specific tax and regulatory issues you must model before buying
This is the section most investors skim and then regret. Canadian STR regulation has tightened materially since 2023, and the CRA’s deduction rules now carry a direct financial penalty for non-compliance.
CRA deduction disallowance: the post-2026 rule
For tax years after 2023, the CRA disallows deductions for the non-compliant portion of short-term rental expenses. The non-compliant amount is calculated as: A × (B ÷ C), where A is total expenses, B is the number of non-compliant days, and C is the total days the property was rented or available for rent. If a property is non-compliant for even part of the year, that proportion of expenses becomes non-deductible, which directly increases taxable income.
What this means for your pro forma: A property that earns $70,000 in gross revenue and incurs $44,000 in expenses, but is non-compliant for 90 of 201 rental days, loses deductibility on roughly 45% of those expenses. That is approximately $19,800 in non-deductible costs, which at a 40% marginal tax rate adds roughly $7,920 to your tax bill for the year. Model this line explicitly before you buy.
Municipal and strata compliance checklist
Before acquiring any resort property for STR use, verify each of the following:
- Zoning — confirm the property is zoned to permit short-term or tourist accommodation rentals. This is the single most important check; without correct zoning, no other analysis matters.
- Municipal licensing or registration — many Ontario municipalities now require STR operators to hold a licence or register annually. Check the specific municipality’s bylaw, not just the province.
- Principal-residence requirements — some municipalities restrict STR licences to a property owner’s principal residence. If the resort property is not your primary home, this rule may prohibit STR use entirely.
- Strata or condo bylaws — resort condo corporations sometimes prohibit short-term rentals or restrict rental periods (e.g., minimum 30-day stays). Review the status certificate and declaration before purchase.
- Permit timelines — in some markets, STR permits are capped or have waiting lists. Factor the timeline to obtain a permit into your cash flow model.
For a step-by-step compliance checklist specific to Ontario, the guide on how to set up a short-term rental in Ontario legally covers the municipal and strata verification process in detail.
An academic study published in 2026 finds that principal-residence restrictions and reductions in full-time STR listings lower long-term rents relative to a counterfactual, which means regulatory tightening can affect both your operating assumptions and the long-term rental market you might pivot to if STR becomes unviable.
How to build a pro forma and benchmark performance with STR data
A credible resort pro forma has three sections: inputs, revenue calculation, and expense/yield outputs. The inputs section is where most investors make errors, because they use market averages instead of comparable-property actuals.
Pro forma structure
Inputs: purchase price, down payment, mortgage rate, amortisation period, ADR assumption, occupancy assumption, management fee rate, cleaning cost per turn, annual fixed costs (insurance, strata, property tax), capital reserve rate.
Revenue calculation: ADR × (365 × occupancy rate) = gross revenue.
Expense and yield outputs: gross revenue minus all operating costs = NOI; NOI ÷ purchase price = net yield; (NOI minus debt service) ÷ cash invested = cash-on-cash return.
Sensitivity table: how net yield moves with occupancy and ADR changes
The table below uses the $650,000 Friday Harbour condo example with fixed operating costs of $44,128 and no debt service, varying only occupancy and ADR.
| Occupancy / ADR | $300 ADR | $350 ADR | — |
|---|---|---|---|
| 45% | 1.2% net yield | 2.4% net yield | 3.5% net yield |
| 55% (201 nights) | 2.8% net yield | 4.0% net yield | 5.2% net yield |
| 65% | 4.3% net yield | 5.6% net yield | 6.9% net yield |
That is the difference between a viable investment and one that only works on paper.
Data sources for benchmarking
- AirDNA — pull ADR, occupancy, and RevPAR at the market or neighbourhood level. Use it to validate your ADR assumption against actual comparable listings, not just the top performers.
- Airbtics — national and market-level supply growth and revenue trends. The 2025 Canada report shows national supply growing at roughly 22.4% year-over-year against revenue growth of approximately 15.5%, signaling increasing competition in many markets.
- Statistics Canada PLTD analysis — use the Statistics Canada STR research to understand how many listings in a given market are likely full-time operators (PLTDs) versus occasional renters. A market with a high PLTD share is more professionally competitive.
- U.S. short-term rental market outlook — useful for cross-border context on occupancy and revenue indicators, though Canadian market conditions and regulations differ materially.
Benchmarks to track: ADR, RevPAR (revenue per available rental day), median occupancy, and year-over-year supply growth rate. When supply growth in a specific market exceeds revenue growth for two consecutive quarters, that is an early saturation signal worth modelling conservatively.
Key risks that can collapse expected yields in resort markets
Resort rental income is more fragile than it looks in a peak-season pro forma. The risks below are not hypothetical; each one has materially reduced returns for investors in Canadian resort markets within the past five years.
- Regulatory change — municipal STR bylaws can change with little notice. A property that is compliant today may require a principal-residence licence next year, effectively ending its STR income. Monitor municipal council agendas in your target market quarterly.
- Rapid supply growth — when new resort developments add inventory faster than tourism demand grows, ADR compresses and occupancy falls. The Airbtics data showing 22.4% national supply growth against 15.5% revenue growth is a market-wide signal; individual resort towns can show much sharper divergence.
- Falling ADR — ADR compression is often the first visible sign of oversupply. If your market’s median ADR has declined year-over-year for two consecutive periods, revise your pro forma assumptions downward before buying.
- Rising operating costs — cleaning labour, insurance premiums, and strata fees have all risen in Canadian resort markets. A pro forma built on 2022 cost assumptions will understate current expenses.
- Strata restrictions — condo corporations can pass bylaw amendments that restrict or prohibit short-term rentals. This risk is highest in resort communities where long-term residents and investor-owners share the building.
- Seasonal structural vacancy — single-season resorts carry months of near-zero occupancy. If your debt service requires year-round cash flow, a ski-only or summer-only property will not cover it.
- Natural hazard and insurance risk — waterfront properties face flood and ice-damage risk; mountain properties face wildfire and access-road closure risk. Verify that your STR insurance policy covers these perils and that the premium is included in your operating cost model.
Early warning indicators to monitor monthly: supply growth rate in your specific market, revenue per listing trend (not just ADR), occupancy trend relative to the prior year, and any municipal bylaw consultations underway.
Actionable levers to increase yield in resort communities
Once you own the property, these are the tactics that consistently move net yield upward, ranked roughly by return on effort.
-
Dynamic pricing — static pricing leaves money on the table in peak periods and loses bookings in shoulder season. Tools like AirDNA’s pricing benchmarks give you the market data to set rates that respond to demand. Review pricing weekly during peak season, monthly in shoulder periods.
-
Photography and listing optimisation — professional photography is the highest-ROI single investment for most listings. A well-photographed listing with an accurate, benefit-led description converts browsers to bookings at a meaningfully higher rate than a listing with smartphone photos.
-
Amenity investments with proven ADR uplift — hot tubs, private docks, and covered outdoor spaces consistently drive ADR premiums in waterfront and mountain markets. Before investing, verify the uplift in your specific market using AirDNA comparable data. A hot tub that adds $40/night in ADR at 55% occupancy generates roughly $8,000 in additional annual revenue; if installation costs $12,000, payback is under two years.
-
Minimum-stay optimisation — a blanket 2-night minimum reduces cleaning frequency and attracts higher-value bookings. In peak weeks, a 3–5 night minimum can increase average booking value without reducing occupancy, because demand is strong enough to fill the longer stays.
-
Pet-friendly policy — allowing pets with a refundable deposit or pet fee expands your addressable guest pool and often commands a $20–$40/night premium. The incremental cleaning cost is manageable with the right protocols.
-
Multi-platform distribution — listing on Airbnb, VRBO, and a direct-booking channel simultaneously increases visibility and reduces dependence on any single platform’s algorithm. Platform fees typically run 3% (host fee on Airbnb) to 8–10% (VRBO subscription or per-booking model); a direct-booking channel eliminates those fees on returning guests.
-
Length-of-stay calendar management — blocking off orphan gaps (single nights between bookings) and adjusting minimum stays by season reduces unbooked nights without requiring a price cut.
-
Guest experience investment — a welcome package, clear arrival instructions, and a curated local guide reduce guest questions, improve reviews, and drive repeat bookings. Repeat guests book direct, which cuts platform fees and increases net yield over time.
Pro Tip: Focus on pricing and photography before spending on amenities. Most underperforming resort listings are leaving money on the table because of weak listing presentation and static pricing, not because they lack a hot tub. Fix the distribution and pricing first, then use the incremental revenue to fund amenity upgrades.
For a detailed checklist of furnished rental property features that affect ADR and guest experience, that resource covers the amenity and furnishing decisions that matter most to resort guests.
What Canadian research tells us about STR markets and investor modelling
The academic and statistical research on Canadian STR markets has matured considerably since 2020, and the findings carry direct implications for how investors should build their assumptions.
Statistics Canada’s PLTD analysis identifies which STR listings are likely to function as full-time rental housing if removed from the short-term market. The analysis uses days-listed thresholds (120 or 183 days) to distinguish occasional renters from full-time operators. For investors, the practical implication is that markets with a high share of PLTDs are more likely to face regulatory pressure, because policymakers view those listings as housing supply being withheld from long-term renters.
Modelling implication: In markets where PLTDs represent a large share of total STR listings, the probability of principal-residence restrictions or permit caps is higher. Build a regulatory-risk scenario into your pro forma that assumes STR income drops to zero in year three and models the property’s performance as a long-term rental instead. If that scenario produces deeply negative returns, the regulatory risk may be too concentrated.
The 2026 academic study on STR regulation finds that principal-residence restrictions and reductions in frequently rented entire-home (FREH) listings cause long-term rents to fall relative to a counterfactual. This matters for investors in two ways: tighter STR regulation can reduce the long-term rental income you could pivot to, and it signals that the policy environment in high-PLTD markets is likely to tighten further.
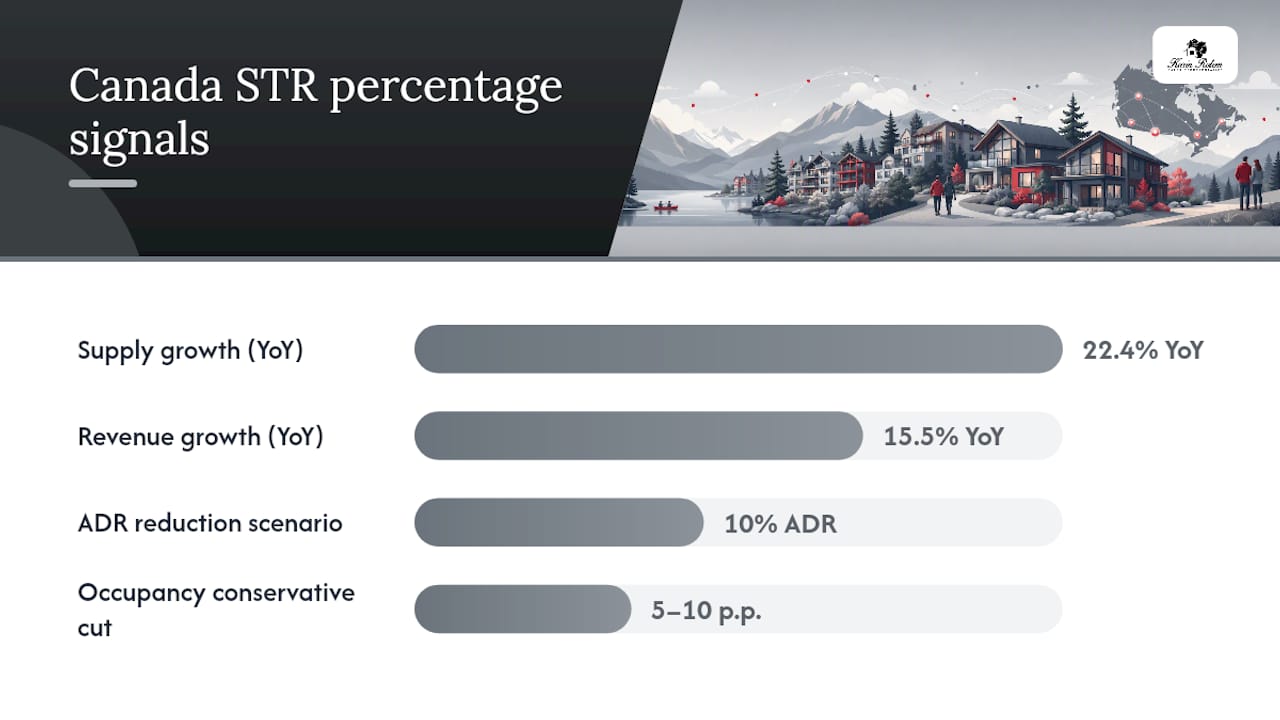
Airbtics’ 2025 Canada market report documents national supply growth of approximately 22.4% year-over-year against revenue growth of approximately 15.5%. That gap is a market-wide saturation signal, though individual markets diverge significantly. Whistler, Niagara Falls, and Bruce Peninsula show stronger revenue growth relative to supply; other markets show the reverse.
Key modelling implications from the research:
- Use a conservative occupancy assumption (5–10 percentage points below the current market median) when supply growth in your target market exceeds 15% year-over-year.
- Model a 10% ADR reduction scenario in any market where supply growth has outpaced revenue growth for two or more consecutive periods.
- Include a regulatory-change scenario in every resort pro forma, regardless of current compliance status.
- Refresh your ADR and occupancy benchmarks monthly for an active listing and quarterly when updating a long-term pro forma.
What I tell my clients when we evaluate resort rental opportunities
What I tell my clients when they bring me a resort property and ask whether it pencils out as a rental investment: the number on the listing sheet is the starting point, not the answer. The answer comes from the pro forma, the compliance check, and an honest conversation about what you are actually buying.
At Friday Harbour, I work with buyers who range from Toronto professionals looking for a weekend retreat that partially pays for itself, to investors who want the property to carry itself from day one. Those are very different underwriting thresholds, and confusing them is the most common mistake I see. For a pure-yield investor, that same property is a pass.
What most buyers don’t realise about Friday Harbour specifically is that the resort’s four-season programming reduces the seasonality risk that plagues single-season Ontario cottage markets. The marina, golf, and dining infrastructure extend the viable rental season meaningfully. That said, the strata fees at Friday Harbour are higher than at a standalone cottage, and those fees are fixed regardless of occupancy. They belong in the pro forma from day one.
The clients who succeed with resort rental investments in Innisfil and the surrounding area share a few traits: they verify zoning and strata bylaws before making an offer (not after), they build their pro forma on comparable booking data rather than the listing agent’s projections, and they have a clear answer to the question “what does this property look like as a long-term rental if STR becomes unavailable?” If that answer is “deeply negative,” they either negotiate a lower price or walk away.
Red flags that cause me to advise caution: regulatory uncertainty in the municipality, a pro forma that only works at top-quartile ADR, and strata declarations that are ambiguous about short-term rental permissions.
For buyers considering waterfront property near Toronto, the Friday Harbour and Innisfil corridor offers a combination of four-season amenity infrastructure and relative proximity to the GTA that is genuinely difficult to replicate elsewhere in Ontario.
How Karinrotem helps resort investors move from analysis to acquisition
Karinrotem works with resort and waterfront investors at every stage of the process, from initial market analysis through to closing and post-purchase setup. For investors evaluating Friday Harbour and the Innisfil corridor, the team brings direct knowledge of which unit types, floors, and orientations have historically performed best as rentals, which strata corporations have restrictive bylaws, and what a realistic pro forma looks like for the current market.
The practical services most relevant to resort investors include: property-specific market analysis, pro forma review and stress-testing against current comparable data, regulatory and strata bylaw verification before offer, and referrals to vetted local property managers and STR compliance specialists. Karinrotem does not manage properties directly, but the team’s network of local operators means you are not starting from scratch when it comes to finding reliable management.
To get started, browse the current Friday Harbour and resort listings or view available investment properties to identify candidates worth running through a full pro forma. When you find a property that interests you, reach out to Karin’s team directly to request a market brief and a first-pass yield analysis specific to that unit. Bring the listing details, your financing assumptions, and any comparable booking data you have gathered. The team can typically turn around a preliminary assessment within 48 hours.
Sources
- Canada
- Short-term rental activity in Canada: an analysis of potential long-term dwellings (PLTDs) – Statistics Canada
- Short-term rental market report 2025 — Canada – Airbtics
- Academic analysis of STR regulation impacts on rents (2026) – Taylor & Francis Online
This article is general information, not a substitute for advice from a qualified financial advisor. Consult a qualified financial professional about your own circumstances before acting on anything here.
FAQ
What is a good net yield for a resort rental property in Canada?
What is the 2% rule and does it apply to resort properties?
Resort properties rarely meet this threshold given their price points and seasonal income patterns, so most resort investors use net yield and cash-on-cash return as their primary metrics instead.
Is a 3% net yield good for a vacation rental?
It may still be viable as part of a long-term hold strategy that includes appreciation, but it requires a stress-tested pro forma and a clear plan for covering the annual cash shortfall.
What does the CRA’s post-2026 STR rule mean for my deductions?
The CRA now disallows deductions for the non-compliant portion of STR expenses, calculated as total expenses multiplied by non-compliant days divided by total rental days. A property that is non-compliant for part of the year loses deductibility on that proportion of costs, directly increasing taxable income. Verify municipal compliance before filing.
What is RevPAR and why does it matter for resort rental benchmarking?
RevPAR (revenue per available rental day) combines ADR and occupancy into a single metric: ADR multiplied by occupancy rate. It is the most useful single benchmark for comparing your property’s performance against the market because it captures both rate and utilisation simultaneously. Track it monthly using AirDNA or Airbtics data for your specific resort market.