
Smaller towns in Canada generally show lower crime rates than major urban centres, but the full picture is more complicated than that headline suggests. Statistics Canada’s police-reported crime data and the Crime Severity Index (CSI) both confirm that many rural and small-town communities record fewer incidents per 100,000 residents than cities like Toronto or Vancouver. The operative word is “many,” not “all.”
Three things to hold in mind before reading further:
- The national average favours smaller places, but aggregated rural figures hide enormous local variation, from some very quiet villages to other communities with high crime rates.
- Regional patterns matter: provinces like Saskatchewan, Manitoba, and Alberta show rural violent CSI values noticeably above their urban counterparts.
- Northern and remote communities are a consistent exception, where concentrated disadvantage, limited services, and geographic isolation push crime rates well above the national rural average.
The sections below walk through the Canadian data, the social mechanisms behind lower crime in many small places, the exceptions you cannot ignore, and what all of it means if you are weighing a move.
Key takeaways
Smaller towns in Canada often show lower overall crime rates than cities, but the violent Crime Severity Index runs higher in rural areas of several provinces, and northern and remote communities are consistent exceptions that national averages obscure.
| Point | Details |
|---|---|
| Overall rates favour smaller towns | Many small communities record lower total crime rates than large cities, driven by social cohesion and fewer anonymous targets. |
| Violent CSI tells a different story | Rural violent CSI values exceeded urban violent CSI in several provinces in 2024, particularly in Saskatchewan, Manitoba, and Alberta. |
| Northern communities are a key exception | Poverty, geographic isolation, and limited services push crime rates in some northern and remote communities well above the national rural average. |
| Ambient population distorts per-capita rates | Tourism and cottage-country towns look safer than they are when incidents are divided by resident population rather than actual visitors present. |
| Karinrotem offers local community checks | Karinrotem’s team reviews local crime trends, police response times, and seasonal population effects for buyers considering smaller communities near Toronto and Innisfil. |
What does Canadian crime data actually show for smaller towns?
Two measures shape every serious conversation about crime in Canada. The police-reported crime rate counts incidents per 100,000 residents. The Crime Severity Index (CSI) goes further: it weights each offence by the average sentence length courts have imposed, so a homicide counts far more than a mischief charge. Statistics Canada’s Juristat methodology explains that the CSI can shift because of investigative or court outcomes, not just incident volume, which is why reading both measures together gives a clearer picture than either alone.
For most of Canada’s southern provinces, the overall crime rate and total CSI tend to be lower in smaller population centres than in large cities. Rural violent crime, however, tells a different story. Statistics Canada’s 2024 release shows the rural violent CSI running noticeably higher than the urban violent CSI in several provinces, with the largest gaps in Saskatchewan, Manitoba, and Alberta.
Key figure: In 2024, rural areas in multiple Canadian provinces recorded a higher violent Crime Severity Index than their urban counterparts, driven in part by certain offences like assault, mischief, and disturbing-the-peace incidents which were reported more frequently by police services covering rural populations.
Provincial and regional variation is substantial. Southern Ontario small towns often look very safe by both measures. Northern Ontario, northern Manitoba, and remote communities in British Columbia and Saskatchewan can record rates that rival or exceed those of large cities. Classification also matters: Statistics Canada notes that using police-service boundaries versus population-centre definitions can narrow or widen the apparent rural-urban gap, so two studies using different definitions may reach different conclusions.
Pro Tip: When comparing community crime data, always confirm which definition of “rural” or “small town” the source is using. Statistics Canada offers both population-centre and police-service-boundary classifications, and the choice changes the numbers.
Why do many smaller towns show lower crime rates?
Several reinforcing mechanisms explain why crime is lower in villages and smaller communities across much of Canada. None of them operates in isolation.
- Social cohesion and informal social control. Residents in smaller communities tend to know their neighbours, which creates natural oversight. When people recognise each other, potential offenders face a higher chance of being identified and social consequences for misconduct are more immediate. Criminologists call this “informal social control,” and it is one of the most consistently cited factors reducing crime rates in close-knit settings.
- Fewer anonymous targets. Routine activity theory holds that crime requires a motivated offender, a suitable target, and the absence of a capable guardian. In a small town, targets are less anonymous, guardians (neighbours, local business owners) are more visible, and offenders are more likely to be known. This combination reduces opportunity.
- Demographic structure. Smaller towns often have a higher share of older residents and families with established roots, demographic groups associated with lower offending rates. A younger, more transient population, common in some urban neighbourhoods, correlates with higher crime in the criminology literature.
- Visibility and neighbour oversight. Physical layout in many small communities means less cover for criminal activity. Fewer high-density apartment blocks, more single-family streets, and a slower pace of foot traffic all increase the chance that unusual behaviour is noticed.
- Lower concentration of high-risk environments. Bars, late-night venues, and transit hubs concentrate potential conflicts. Smaller towns typically have fewer of these, which reduces the situational triggers for assault and property crime.
A 2025 Statistics Canada analysis reinforces this picture by identifying poverty, geographic isolation, and limited services as the factors that raise crime in some rural communities, implying that their absence in stable, well-serviced small towns contributes to lower rates. For buyers considering lifestyle-driven real estate outside major cities, these mechanisms are worth understanding because they point to what makes a community genuinely safer, not just statistically quieter.
When do smaller places have higher crime than cities?
The aggregated rural average is a useful starting point and a misleading endpoint. Statistics Canada is explicit that rural communities span a wide spectrum: some record very low crime, while a smaller number record very high rates. Treating the average as representative of any specific community is a real analytical error.
Several drivers push crime higher in certain small and rural places:
Concentrated disadvantage. High unemployment, persistent poverty, and limited economic opportunity create conditions where crime rates rise regardless of population size. Some resource-based towns and post-industrial communities in the Prairie provinces fit this pattern.
Northern and remote communities. Geographic isolation limits access to mental health services, addictions treatment, and victim support. Combined with higher rates of poverty and historical trauma in some Indigenous communities, this produces crime rates that are among the highest in the country. The 2025 Statistics Canada analysis names geographic isolation and limited services as direct contributing factors.

Seasonal tourism gateways. A town of 3,000 permanent residents that hosts 30,000 visitors on a summer weekend has an ambient population problem. Crime incidents are divided by the resident base, not the actual number of people present, which understates risk per person on the ground. What I tell my clients considering waterfront properties near Toronto: always ask about peak-season incident data, not just the annual per-capita rate.
Small-number volatility. In a town of 800 people, three additional assaults in a year can swing the per-capita rate dramatically. This statistical noise makes year-to-year comparisons unreliable for very small communities and is one reason the CSI, which smooths some of this volatility through weighting, is a useful companion measure.
Rural criminology research also notes that many crime-prevention programmes were designed for urban contexts and do not translate well to rural settings, which means some high-crime rural communities have fewer effective interventions available to them.
How is crime measured in Canada, and where can the data mislead you?
Understanding the measurement is as important as reading the number. Two pitfalls trip up most casual readers of crime statistics.
Resident population versus ambient population. The standard rate divides incidents by the number of people who live in a place. In a tourism or cottage-country community, the actual number of people present on a busy weekend can be several times the resident count. The rate looks low; the real exposure may not be. The CSI methodology is an area-based measure and shares this limitation.
Reporting differences. Rural and northern communities often have fewer victim services and less investigative capacity, which means some crimes go unreported or unrecorded. A lower reported rate in a remote community may partly reflect under-reporting rather than lower actual incidence.
Classification rules. As noted in Statistics Canada’s 2021 rural-urban analysis, the boundary between “rural” and “urban” shifts depending on whether you use police-service boundaries or population-centre definitions. Two credible sources can show different rural-urban gaps simply because they drew the line differently.
Pro Tip: Ask your local police service for the annual statistical report specific to your detachment or division, not just the national or provincial summary. Many Ontario Provincial Police detachments publish community-level data that is far more useful than provincial averages when you are evaluating a specific town.
What should you check before moving to a smaller community?
Translating research into a practical pre-move checklist is where the data becomes genuinely useful. Here is what I recommend to clients considering a move outside the GTA.
- Pull the local crime rate and CSI trend over three to five years. A single year can be misleading; a trend tells you whether the community is stable, improving, or deteriorating. Statistics Canada’s community profiles and municipal police annual reports are the right starting points.
- Identify the police service and its boundaries. Know whether the community is served by the Ontario Provincial Police, a municipal force, or an Indigenous police service, and confirm the detachment’s response-time targets for your specific address.
- Ask about emergency response times. In rural areas, the distance to the nearest fire station or hospital matters as much as the crime rate. Community amenities and service proximity are part of the safety picture, not separate from it.
- Check for seasonal population effects. If the community is a tourism or cottage destination, ask the local police service or municipality for summer versus off-season incident data.
- Look for visible signs of investment or decline. Active local businesses, maintained public spaces, and community programmes are positive indicators. Boarded storefronts and deferred infrastructure maintenance correlate with the concentrated disadvantage that drives higher crime.
- Talk to neighbours and local agents. No dataset captures what long-term residents know about a street or neighbourhood. A local agent with genuine community ties is a faster path to honest answers than any public database.
- Check victim services availability. If something does happen, proximity to counselling, legal aid, and support services matters. Remote communities often have significant gaps here.
Remote work has expanded the pool of buyers willing to consider smaller towns, and that shift brings new questions about the benefits of small-home investments in 2026. Safety is consistently near the top of that list, which makes doing this homework before signing anything genuinely worthwhile.
What I tell clients weighing safety and lifestyle in smaller towns
What I tell my clients when they ask whether a small town is “safe enough”: the question is almost always the wrong one. The right question is whether this specific community, at this specific price point, has the stability, services, and social fabric that match your life.
A family I worked with recently was considering a move from Toronto to a waterfront community north of the city, drawn by the lifestyle and the price differential. On paper, the town’s crime rate looked excellent. When we dug into the data, though, we found that the per-capita rate was calculated on a small year-round population, while the community swells significantly in summer. The resident-based rate was genuinely low in winter. Peak season was a different story. We also confirmed that the nearest OPP detachment had a longer average response time than they were comfortable with given young children at home.
They still bought. But they bought with clear eyes, in a part of the community with active year-round neighbours, close to the main road. That is the kind of nuance that a local agent who knows waterfront buying can surface in a way that a national crime map simply cannot. For Friday Harbour specifically, I have written about how safety and community design work together in ways that make it a genuinely different proposition from a typical small-town purchase.
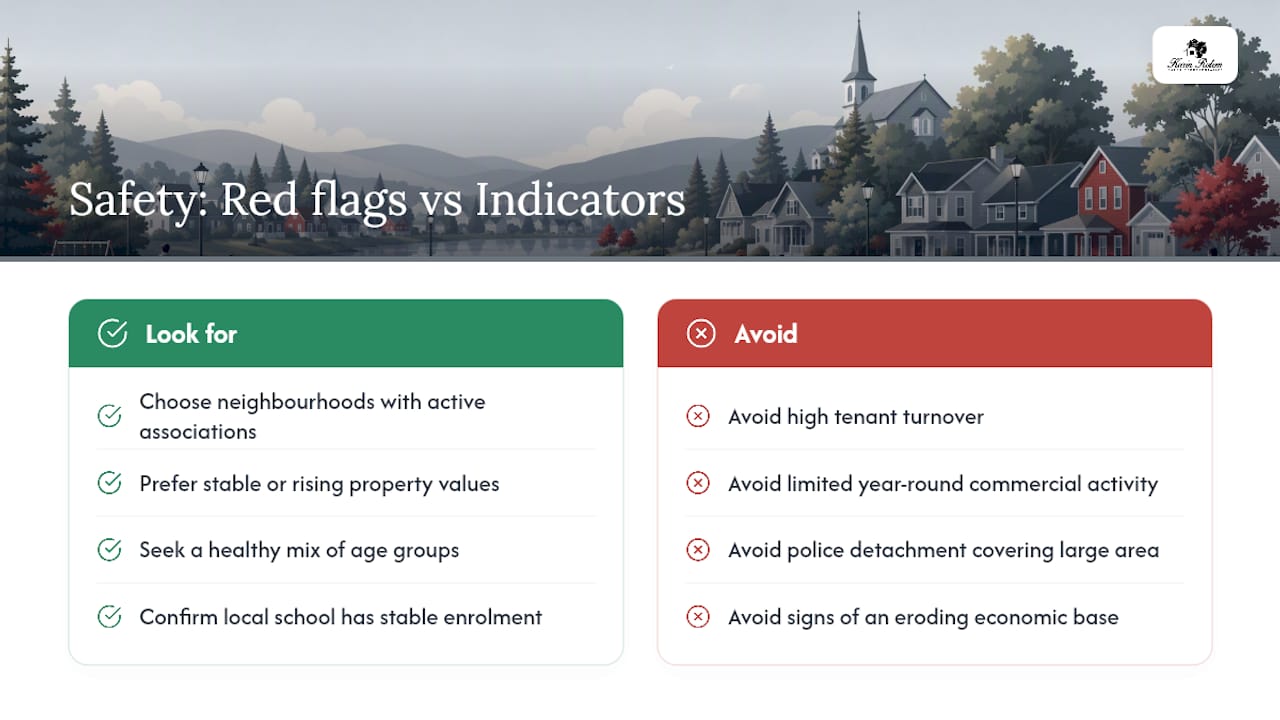
Red flags I look for: high tenant turnover, limited year-round commercial activity, a police detachment that covers an unusually large geographic area, and any sign that the community’s economic base has eroded. Positive indicators: active community associations, stable or growing property values, a mix of age groups, and a local school with stable enrolment.
Ready to find a community that fits your life and your safety standards?
If you are weighing a move to a smaller town or a waterfront community in the Innisfil and Friday Harbour area, the data in this article is a starting point, not a substitute for local knowledge. My team works specifically with buyers who want to understand not just what a property offers, but whether the community around it is the right fit for their goals and their family.
We run community safety checks, review local police data, and ask the questions that do not appear on any listing sheet. Whether you are looking for a primary residence, a weekend retreat, or an income property, browse our current properties to see what is available in communities we know well, or reach out directly for a tailored community-fit consultation.
Sources
- Police-reported crime in rural and urban areas in the Canadian provinces, 2024
- Scholarly analysis on rural criminology and program fit (ScienceDirect article)
FAQ
Why does Canada have a lower crime rate than many comparable countries?
Canada’s relatively lower crime rate reflects a combination of strong social services, lower income inequality than many peer nations, and robust policing institutions. Statistics Canada’s Crime Severity Index has trended downward over several decades, though recent years show increases in some violent offence categories.
Are smaller towns in Canada always safer than cities?
No. Many smaller towns record lower overall crime rates, but rural violent CSI values exceeded urban violent CSI in several provinces in 2024. Northern and remote communities, tourism gateways, and resource towns with concentrated poverty can record rates that rival or exceed large cities.
How do I find reliable local crime data for a specific Canadian town?
Start with Statistics Canada’s community crime profiles and your provincial police service’s annual statistical report. For Ontario communities, the Ontario Provincial Police publishes detachment-level data. Municipal police services often publish annual reports with neighbourhood-level breakdowns.
Why do per-capita crime rates sometimes overstate risk in small towns?
In very small communities, a handful of additional incidents can dramatically shift the per-capita rate. Tourism and cottage-country towns also divide incidents by their small year-round resident population rather than the much larger number of people actually present in peak season, which understates real exposure.
Does Gen Z commit less crime than previous generations?
Statistics Canada data shows that youth crime rates in Canada have declined over recent decades, a pattern consistent with trends in other comparable countries. Criminologists attribute this to multiple factors including demographic shifts, changes in routine activities, and longer time spent in education, though the research on generational differences specifically remains an active area of study.